%20Logo_BlueOrange_Trademark.png?width=800&height=269&name=Ready%20North%20(RN)%20Logo_BlueOrange_Trademark.png)


.jpg?width=300&name=Services%20Hub%203%20(3).jpg)

 The shift to inbound marketing has armed marketers with tactics to better connect with leads and customers, technology to increase efficiencies, and access to more data than ever.
Access to inbound marketing data means it’s easier than traditional methods to track performance and prove ROI.
Just think: Can you really trace the performance of a newspaper ad easier and faster (if at all) than clicks on a blog post?
However, the old adage “quality over quantity” also applies to data— it’s not enough to simply have thousands of data points. Instead, marketers need to apply both structure and meaning to these numbers because without a layer of context, it’s just noise.
But if you’re anything like me (not a data scientist or mathematician), it can be tricky to understand where to start or what data points to dig into to really make sense of it all. Even with access to data tools like Google Analytics or HubSpot’s reporting features, it’s still necessary to understand what the numbers truly mean to affect performance and implement real-time change.
At our recent Cleveland HubSpot User Group (HUG) meeting, PR 20/20’s VP of Strategic Growth and in-house data wizard, Keith Moehring (@keithmoehring), uncovered how marketers can dive into data to apply meaning.
Continue reading below as we highlight 12 actionable tips and tricks to unlock the true potential of your marketing data.
1. Define Goals
Before digging into data, it’s important to define what your team is trying to achieve and what success looks like. These are known as your goals.
But defining goals can be tricky business.
Start with the business’ objectives, and then work backwards to figure out how marketing can contribute to these goals. Think in terms of the funnel for these overarching goals (ex: drive awareness, traffic, leads, sales or customer retention).
When establishing goals for both marketing and your business at large, make sure they’re SMART:
- Specific: Clearly established what is to be achieved
- Measurable: Can you track it?
- Attainable: Can you realistically hit that number
- Relevant: Is it truly relevant to the business goals
- Timely: Has a target end date.
SMART goals lay the foundation for more intelligent data mining, and will be the metrics you track towards to show performance and progress.
2. Find Your Source of Truth
Question: Have you ever tried to compare sessions in HubSpot to sessions in Google Analytics? If so, you’ve probably noticed that they don’t always line up. Reason being, each system defines and tracks a “session” differently. The same goes for other metrics, as well.
Disparate data causes serious headaches for marketers, which is why it’s imperative you define a single source of truth. If you prefer to rely on Google Analytics versus HubSpot or another automation solution for data, then communicate that to your team and commit to it.
Keep in mind the strengths of each data tool. For instance, Google Analytics is strongly suited for website engagement metrics, while HubSpot can’t be touched when it comes to lead and sales data.
3. Scrub Your Data
Who doesn’t love seeing a positive spike in data? It’s easy to ride out those fluctuations, especially when it appears that a marketing campaign may have positively affected website performance.
But when you look a bit closer at fluctuations, it may appear that traffic is unqualified.
The following are actionable tips to help clean your data:
- Filter out internal IP addresses that can skew your data (e.g. if employees are frequenting the site). To find your IP address, visit this site.
- Exclude unqualified, ghost spam. For example, PR 20/20 has found that many of our clients see spikes from Ashburn, VA, which is home to a large Amazon server.
- Block referrals from automation software previews (ex: app.hubspot.com or preview.hs-sites.com), which will increase unqualified views to specific pages as you build them out and preview in your system.
- Remove query parameters in Google Analytics sent from your automation software (ex: “hsCtaTracking” or “hs_preview”).
From here, you’ll be able to see a cleaner, more holistic view of qualified web traffic.
4. Segment Where Possible
Your website is a worldwide hub for everything about your company— resources, branding, sales material, contact information, etc. But, keep in mind that visitors have different intents, and it’s important to segment to understand their goals, browsing interest and familiarity with your brand.
Evaluating website traffic or leads as a whole isn’t going to yield data as valuable as it would if you grouped each by some common denominator. For instance, if you’re a SaaS technology provider with a “login” button on your site, create a segment that groups all visitors that click that button. Then, apply that segment to filter out any sessions that include a click on the login link. This will leave you with a better sense of how top of the funnel website visitors are getting to and interacting with your site.
5. Create Dashboards
During his HUG presentation, Keith posed the question, “How many of you like sorting through report after report trying to piece a cohesive story together?”
Let’s just say there was a vibrant sound of crickets in the room…
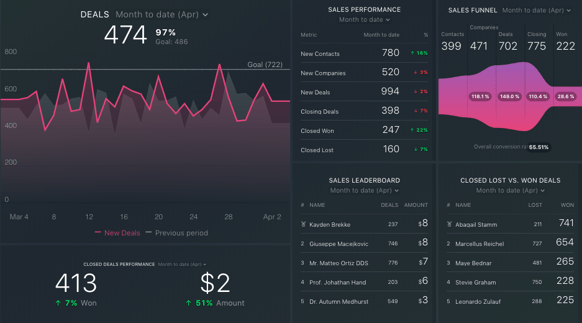
For those of us who don’t prefer to spend hours analyzing data, dashboards are our best friends. Dashboards help to consolidate the most important metrics into one easy-to-scan format.
For HubSpot users, you’ve likely noticed the dashboards page as soon as you login to the system. HubSpot’s customizable dashboard feature offers about 90 different reports, so you can personalize what data you’ll see. Report options cover everything from contacts to companies to marketing to sales.
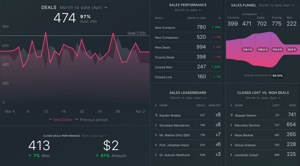
Hate jumping from system to system to view dashboards? Us, too. That’s why the PR 20/20 team relies on Databox for an all-in-one data visualization tool.
Databox has deep integrations with about 50 different data tools and automation platforms like Google Analytics and HubSpot. So, marketers are able to pipe in all data streams to one dashboard to get a visualized view of website performance, lead generation, blogging and paid performance. Dashboards also support finding your source of truth because you can pair metrics from different data sources together in one board.
>>> Related Resource: Join Cleveland HUG for more events like this. You’ll get access to new ideas, latest information HubSpot, and support the success of local businesses.
6. Ask Why… Five Times
Have you ever had a conversation with a four year old who repeatedly asks “why?” Generally, outside of attempting to get a reaction from you, kids usually ask why so many times because they’re attempting to piece their own world together. As marketers, we may be able to learn something from these youngins.
Why is a very powerful question that can help you peel back layers to get to the root cause of data fluctuations. For instance, let’s say you saw that website sessions spike on a specific day. Do the following:
- You see the traffic increased. Why?
- You find that organic search traffic increased by 500 sessions. Why?
- You see that organic search increased via Google only. Why?
- You find a specific category of pages (e.g. product specifications) are collectively up. Why?
- Turns out Google search results for the product names reveal that your site is the only one on the Internet to offer product specification details.
Keep asking “Why?” until you get some actionable hypothesis that you can prove out one way or the other. More often that not, the last “Why?” will require venturing outside of your Analytics or Marketing Automation Tool, but at least these technologies can point you in the right direction.
7. Ask “Does it Matter?”
Marketers know that we have plenty on our plate throughout the day without wasting time going down dead ends that won’t pay off in the long run.
Apply a critical filter to your five whys findings by asking, “Does it matter? Can what I’ve learned get me closer to my goal?” You can usually use engagement metrics to help answer this question. If traffic was unengaged or unqualified, does it really matter to your overall goal?
For example, back in 2009, PR 20/20 published a real-time blog post that talked about the Taylor Swift and Kanye MTV Video Music Awards drama (remember that?). A huge spike in traffic occurred to that specific blog post in mere hours. However, the majority of traffic bounced quickly, didn’t view any other pages, only stayed on the site for minimal time and didn’t complete a single goal.
With these engagement metrics, the team was able to diagnose that this traffic was unqualified. Visitor weren’t coming to the site to learn about our inbound marketing services or read industry trends. Instead, they were trying to read up on the latest pop culture, and then leave. So, when asking “does it matter?” the answer was while the traffic increase was nice, it was unqualified and ultimately didn’t matter.
8. Set Up Alerts
As a marketer, it’s our worst nightmare to be called out by a boss, colleague or client about a data function that we aren’t able to answer or weren’t aware of. Luckily, you can eliminate this issue with alerts.
HubSpot, Google Analytics and even certain data visualization tools like Databox can notify you if something happens, so you can proactively communicate and explain it. For instance, set up alerts for spike and dips in traffic and leads, as well as if a goal is hit or in danger of being missed.
9. Take Advantage of HubSpot Features
HubSpot has many features that come with their own reports. For example, HubSpot’s campaign analytics tool allows you to:
“...measure the effectiveness of the marketing campaigns you've created in HubSpot. The tool analyzes five metrics to quantify how your marketing content contributes directly to traffic, leads, closed deals and revenue.”
10. Use Bots
There are several different ways to “ask the bots” to help make sense of your data and increase efficiencies in analysis.
GrowthBot is a chatbot for marketing and sales, or anyone working on growing a business. GrowthBot connects to a variety of marketing systems (like HubSpot, Google Analytics and others) and databases, and gives you quick, easy access to information and services.
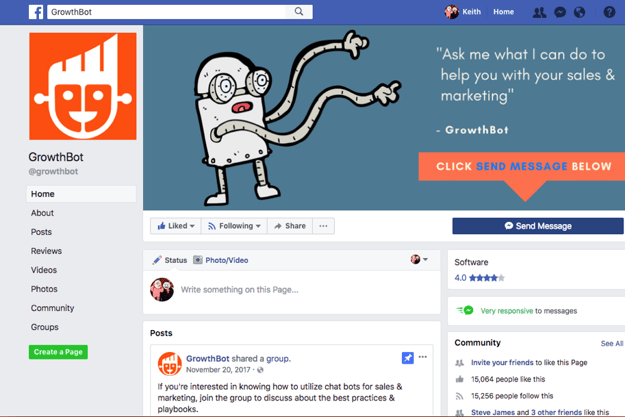
To get started just ask it what it can do. Example commands include:
- What are top articles on growth hacking?
- What software does hubspot.com use?
- How was organic traffic last week?
Google Analytics’ mobile app also features a bot that can answer questions about data fluctuations and call out insights you may have overlooked.
11. Automate Your Narratives
With every great data analysis comes a written narrative to help us non-number-loving folks answer the “whys” and understand fluctuations. But data narratives are also one of the most labor intensive parts of data reporting.
Narratives help us create a story about what happened, why it happened and what it means for our marketing efforts. From there, we’re able to make actionable recommendations and apply historical data trends to future marketing campaigns.
At PR 20/20, we rely on Automated Insights to help us automate the narrative. Automated Insights uses natural language generation (NLG) and pre-written scripts to compare and contrast data in written word. What used to take our team hours to write now takes a mere seconds to generate.
12. Quiz Your Team
Successfully analyzing data and creating structure for data is all reliant on how well you know your data tracking solution. But it can’t be just you. Your entire team needs to understand the importance of structured data, and how these numbers can be applied for actionable campaign-level insights.
Both Hubspot and Google Analytics offer platform training certifications, which are
good for a base understanding of what’s possible. But our team’s experience proves that the only way to learn the solution is to get your hands dirty.
As a first-year employee at PR 20/20, you’re required to fulfill certain professional development points, which include what we call the Google Analytics Practicum. After getting certified in Google Analytics, employees are enrolled in the practicum, and they get a quiz via a Hubspot workflow few days.
Quizzes are actual scenarios or defining metrics that are often misinterpreted. These quizzes require you to understand where to click in each system and how to get to the bottom of the scenarios. So after you get product certified, you have to demonstrate that you actually know and understand how to use the tools.
Make Your Data Actionable and Meaningful
Perfecting the data analysis process may be a long-term goal, but you don’t have delay kicking it off. Get the right tools to set you off on the right foot to meet your data analysis goals.
Learn what’s possible with top-notch marketing automation solutions that layer in data reporting like HubSpot. Let’s discuss what’s possible for your business.


COMMENTS